Abstract
Diet can have a great effect on health, but few people keep track of what they eat each day, let alone how much fat, protein, Calcium, or other nutrients. Although most food items have nutrition information printed on the packaging, few people can tell you whether or not the 10 grams of fat in their candy bar is acceptable, or whether it has put them over the edge.
In this project the author assumes that a big part of the reason people do not keep track of their diet is that there is no easy way to do so. The final product of this project is Mealographer, a simple interface that allows users to enter in the foods and meals they eat each day, set simple nutrition goals, and see reports of their progress. Mealographer was created by implementing a large number of improvements to the product of a previous investigation, WhatYouEat. A usability test was conducted to evaluate Mealographer and find specific usability problems.
Previous Work – The WhatYouEat Project
Mealographer inherits much of its functionality from a previous project, titled WhatYouEat, part of an individual investigation from fall, 2005. The original project had two goals: to create an application that allows users to track their dietary intake, and to make the application as easy to use as possible.
WhatYouEat allowed users to record their meals, set simple goals for different nutrients, and
track their diet through simple reports. Supporting functionality included a simple user sign up and login system, and systems allowing users to indicate favorite foods and “usuals” – foods eaten on a regular basis.
WhatYouEat was demonstrated informally to several groups and an informal usability test was run with four participants. Although this style of evaluation was not rigorous, users were asked to use the site and comment on any confusion or difficulties. Many users also commented on design and additional functionality. Usability issues included difficulty in:
Targeting
- Even with a large screen size and large font, it was hard for one subject to click on fields before entering text.
- Field labels were used to enlarge the clickable area. It may be possible to have the cursor will default to the first field.
Layout
- Two users were a little confused about the two-column layout of input forms.
- A thin line was added to help make the grid more clear.
Forms
- Three users forgot to set the meal date at least once. The submit button was easy to miss. One user hit enter to submit the search form and didn’t expect the entire meal to be submitted. There were problems using the back button.
- The submit button was made more visible
- The forms were be broken up so that the submit button for a particular field only submits that field.
- Required fields could be made more clear with a symbol and some JavaScript.
Labeling
- Some labels were unclear or hard to read. In particular, dates presented in yyyy-mm-dd format and names of nutrients.
- The labels should be changed to reflect user expectations.
Measurements
- Many users had a hard time determining how much they had eaten, or understanding how much food each measurement amount actually represented. Few of them knew what an ounce or gram of a given food looked like, or how much of non-fluid items made up a cup.
- Some graphic representation of food amounts should be available in the system, as well as a conversion application. See Future Plans for more information on the approach to this problem.
Missing items
- Users more than once looked for food items that did not appear to be in the database at all. This included brand-name items or items from specific restaurants. This is a limitation for the USDA database.
- There is no simple or quick solution to this problem. See Future Plans for more information on the approach to this problem.
Mealographer Features and Functionality
Mealogapher includes a number of improvements to the existing WhatYouEat functionality as well as some additional features. Major new and improved features include:
Information Design
WhatYouEat had simple, somewhat consistent design that did not convey much information about the content of each page. Mealographer was designed to
Action blocks – on each page where a series of actions are appropriate next steps, those actions are placed in a lighter-colored box with a descriptive title.
Simple icons – small icons are used throughout the site to quickly convey small bits of information. For example, purple arrows replace list bullets on action items in blocks. The Calendar employs icons to indicate whether or not a goal has been met.
Nutrition information – The nutrition information for foods and meal totals has been designed to match the familiar nutrition information boxes on foods.
Link highlighting – Many links, including the navigation bar and action items, have been given a highlight when the user’s mouse hovers over.
Language
Care was taken to make the verbiage used on the site straightforward, concise, consistent, and in line with the site’s brand. For example, when users are presented with options they are asked, “would you like to… Add another item to your usuals.” Users are addressed directly by the site, and not given static items like “Add usuals,” or “My usuals.”
Home Page
The homepage has been redesigned to be a central gateway, allowing easy access to site features, as well as an introduction to the site. The homepage has two different configurations: a “general public” version for site visitors and new users that have not yet logged in, and a “personal” version for logged-in users.
Public Homepage
The general public homepage was created with two goals in mind: first, to introduce new users to the site; and second, to intrigue and draw them in by giving them features to try out. The first goal makes sense since new users must know what the site does if they are to ever use it. The second goal was inspired by the fact that when presented with a choice, people generally chose to stay with the status quo (Stafford & Webb, 2005, p. 246). The status quo in effect when a user reaches a new, possibly complex web application for the first time is simple—do nothing. Mealographer presents an additional challenge, because most people do not actively track their diets. Using a diet-tracking site will be a big divergence from the status quo for many new users.
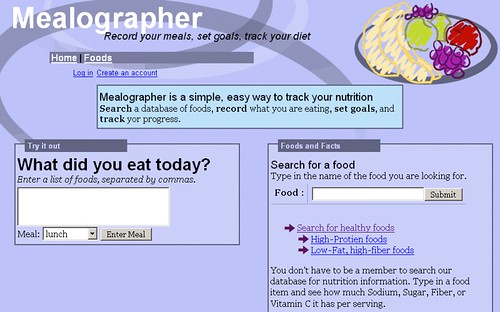
Illustration 1: Public home page
The public homepage is intended to break visitors out of the status quo by giving them a simple, quick way to try the site out. The interface must be immediately apparent because users can make decisions about web designs in as little as 50 ms (Lindgaard, Fernandes, Dudek, and Brown, 2006). The way to make it apparent that a user can interact with a site is by presenting clear affordances, or visual impressions that imply likely use (Gibson, 1979, p.127). Cultural, learned conventions can be used to help users perceive affordances on a computer screen (Norman, 2004).
Visitors are presented with two elements to try. The first is the “What did you eat today?” quick meal entry form, which allows users to begin using the site’s functionality with as little investment of time and effort as possible. The second is a “Search for a food” form that acts as a simple search engine. In order to take advantage of cultural conventions, a multi-line text area was chosen to allow visitors to type in items they’ve eaten, and a single-line text input was used for the food search.
Personal Homepage
The personal homepage both acts as a central location for registered users to find and discover functionality and a top-level view of the actions they are most likely to want to do at the current time. Entering meals and watching diet changes are both activities with strong temporal dimensions. Accordingly, a daily “to do” calendar was chosen as the metaphor for the list of meals entered and yet to be entered, and a monthly calendar is used to display a high level view of progress. Both employ simple visual cues to give users an immediate impression. Completed activities are marked off the to do list with check marks, and smiling or frowning faces are displayed on the days of the monthly calendar to show if a goal has been met for each day.
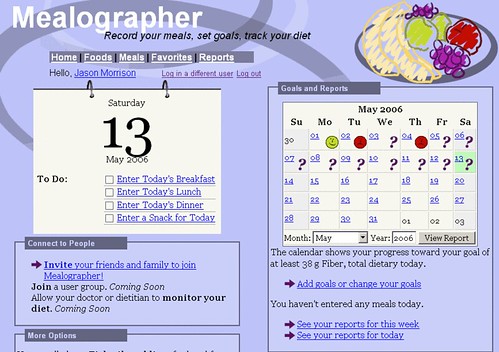
Illustration 2: Personal home page
The rest of the items on the personal homepage are organized into the action blocks “Connect to People,” “More Options,” “Goals and Reports,” and “Foods and Facts.”
Food Pages
Nutrition information about the food items in the database was used to generate a detailed page for each food. The pages include the nutrition information box, a food search form, and links to other similar foods in the database. They serve three purposes: first, users can search for and find information about a specific food. Second, the pages can be linked to from multiple locations in the site, wherever users might see a food name and want additional information. Third, the pages would be available to outside search engines, and might therefore act as landing pages for visitors and new users.
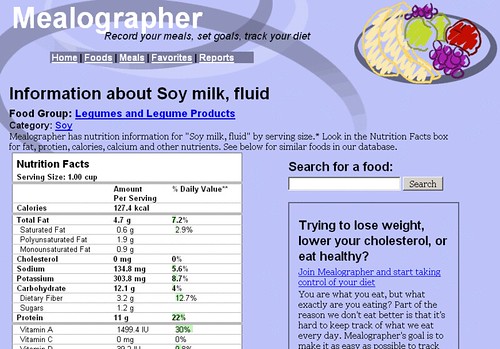
Illustration 3: Example food page
Although the information is from the database, these pages are not dynamic. Instead, static HTML pages are generated from the database and then saved and uploaded to the web host. Nutrition information is unlikely to change, so this technique saves web server processing time and database access.
Food Search and Folksonomies
One of the most apparent usability problems of WhatYouEat was the food search. Food search is a standalone function and is an inherent part of meal entry, so it is critical that it be improved. Problems stem from three main areas:
Missing items – although the USDA database contains thousands of foods, it is missing many items users are looking for. Many brand-name items are not in the list, as well as ethnic foods and composite foods (there is no general entry for “sandwich” or “salad”). Possible fixes to this problem include searching for and entering new foods, allowing users to enter new foods, and allowing users to build recipes from multiple foods. None of these options were implemented in this time frame.
Naming and Labeling – the USDA database uses very precise names for many foods. These names are very useful for professionals, but do not match language used by typical users. For example, a user might search for “Coke,” when the database has “Carbonated beverage, cola, contains caffeine.” The solution to this problem implemented in Mealographer is a behind-the-scenes tagging system to build up a folksonomy for foods. Tagging systems can allow for both majority consensus on labels or search terms while maintaining minority opinions as well, and allow sites to harness information entered by users for personal use for wider benefit (Golder and Huberman 2006).
The tagging system implemented in Mealographer does not directly ask users for keywords for each food—that would be an extra step, and it is hard to see the immediate benefit a user would receive for their tagging work. Instead, as users perform searches, the system silently remembers the keywords used and the food ultimately chosen and builds tags automatically. A robust tag set requires many users, so it may be difficult to judge the value of the tagging system at this time.
Technical Limitations – by default, the search engine included in MySQL uses a fairly simple search engine which does not meet high expectations users have gained from using advanced engines like Google. In addition, the MySQL full text search ignores all works three characters or less. This can be useful in screening out words like “and” or “for,” but is less helpful when a user searches for “Big Mac.” As the folksonomy grows and tags are added, these limitations might become less important.
Healthy Food Search
In addition to searching for foods by keyword, an interface was created to allow users to search for foods by nutrient content. For example, a user can search for foods that are high in protein, or low in fat and high in fiber. Users may also filter by food group.
New User Invitations
A simple interfaces has been added to allow current users to send invitations to others via email.
Navigation
One finding from the presentations of WhatYouEat was the strong expectation among users to have a navigation bar near the top or left side of the screen. A navigation bar has been added with links to “Home,” “Foods,” “Meals,” “Favorites,” and “Reports.” Because the latter three items only work for registered users, those items are removed from the navigation bar for visitors.
Navigation is also facilitated by the user of appropriate action item links in an action box on most pages. For example, after a user enters a meal, they are given four options: “Make changes to this meal,” “Enter in a new meal,” “See your daily report,” and “Return home.” Users can use these to move from activity to activity in a logical progression.
Help and Validation
Originally Mealographer was going to include a help system such as a FAQ page. In order to more directly user test the interface, the help system was left out. A few new features do provide some user support, however:
Form hints and validation – On several forms, such as the new user form, required items are marked with “* required.” As the user completes each form field, the text turns from red to green.
Bug reports – Users are able to report bugs using the “Report a Problem” link in the footer of each page.
Tour – a page was added explaining the major functions of the site. The tour is shown as an action link after a new user signs up and is available on the footer.
Reports
WhatYouEat had a simple reporting system that allowed users to see bar charts for a particular nutrient for a particular time period. A user could see their total Calcium intake for each meal on a particular day, each day of a week, or each day of a month. A number of improvements have been made to the report system for Mealographer. Users are given a better system to see if they have met their goals, with bars falling short colored red and those meeting the goal in green. The monthly report has the calendar from the personal home page integrated into it. The reports now support a complete drill-down capability, with users able to go from month, to day, to nutrition details about a single meal.
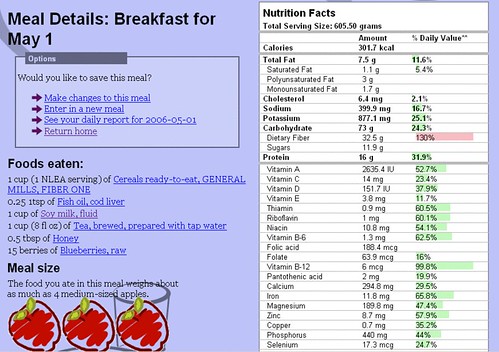
Illustration 4: Nutrition information report for a meal
The nutrition information report for meals is a new feature, reached via the other reports and displayed after a meal is entered. It includes a nutrition information box for the meal, a list of foods and amounts eaten, and a meal size graphic relating the size of the meal to an equivalent number of apples. The meal size graphic can help users judge their portion sizes.
Charts and Statistics
One benefit of building Mealographer as a web application is that the data for all users is available in the same database. This database allows the generation of interesting charts and statistics. For example, queries could be written find the most popular food in a particular state or city, the average calories consumed each day by users, or the weight of all meals entered all together.
Because of the limited number of users, only one such feature was implemented at this time – the popular foods list. The homepage includes this list, ranked by the number of times the food was used in a meal.
Social Features
Eating is a social activity, and dietary changes are often prompted and monitored by medical professionals. Two features were partially implemented (and are currently disabled) in Mealographer to address these facts. Users would be able to form social groups by inviting each other into their “circle,” and another feature would allow users to make their data available to their doctor, dietitian, or trainer.