Tag Archives: presidential election

blogging cartograms comment spam compliment spam election election results electoral college exact phrase search Google information design information graphics Map App of the Day maps poll spam

Okay, we should dump the Electoral College – but no need to spam my blog!

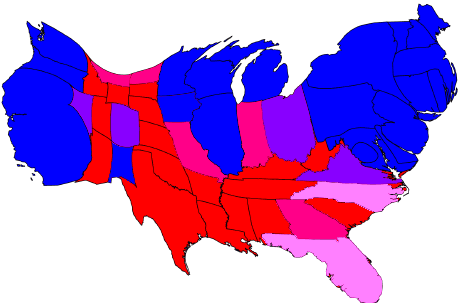
One of the things I mentioned in my last post was how the Electoral College distorts the vote in favor of those in small-population states.

I got a comment from NationalPopularVote.com along these lines…

The major shortcoming of the current system of electing the President is that presidential candidates concentrate their attention on a handful of closely divided “battleground” states. In 2004 two-thirds of the visits and money were focused in just six states; 88% on 9 states, and 99% of the money went to just 16 states. Two-thirds of the states and people were merely spectators to the presidential election. Candidates have no reason to poll, visit, advertise, organize, campaign, or worry about the voter concerns in states where they are safely ahead or hopelessly behind. The reason for this is the winner-take-all rule under which all of a state’s electoral votes are awarded to the candidate who gets the most votes in each separate state.

They make a good argument, and I agree with them, but I find it pretty reprehensible that they are spamming blogs to make their point.  If the comment is on-topic, why do I call it spamming?  Grab a snippet of text and do an exact-phrase Google search by wrapping quotes around it, like this:

http://www.google.com/search?q=%22of+the+states+and+people+were+merely+spectators+to+the+presidential%22

As of this writing there are 233 occurrences of the exact same comment slathered all over the web.  It looks like they’re using an automated program to watch Technorati or Google Blog Search for posts about the Electoral College and autopost the same comment.  I’m going to email them and ask that they stop.

The phrase search is a good technique for discovering compliment spam as well.

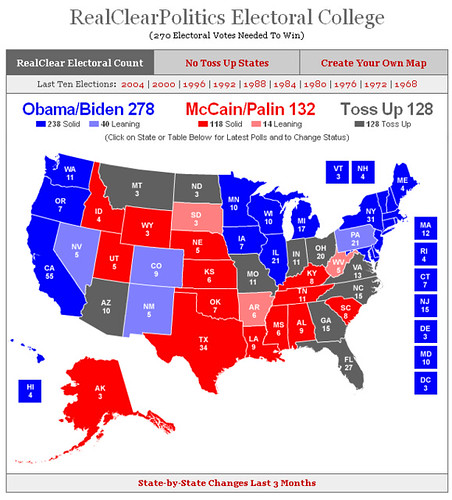
In any event, we already looked at the fact that some people’s votes count four times as much because they live in a state with a small population.  Do the NationalPopularVote.com folks have a point about swing states?

One way to look at the power of your vote is to figure out the likelihood that yours will decide the election.  By this definition, it helps a little to be in a small-population state but the most important factor is how close the election is in your state – your best bet is to live in a swing state.  Andrew Gelman has a great article explaining why, but it’s pretty intuitive.  If you live in a safe Democrat state, for example, it doesn’t matter if you live in California or Rhode Island – your vote is much less likely to be the one to flip the state to one side or the other.  The same is true for safe Republican states, from Texas to Wyoming.

Map App of the Day: Presidential Election Maps

It’s just two days until the U.S. Presidential election.  I thought I’d talk a bit about how elections are covered with information graphics, specifically maps.

To get things started, CNN has has a map of early voting participation numbers.  For some states, they even have participation by party and by county.  This particular map is disappointing – no real effort is made to illustrate the information, all the real data is just text in callout boxes.  It might even be more efficient just to put the data in a big table like this page at George Mason University.

cnn-early-vote

Real Clear Politics’ mapping application is interesting because it gives you to ability to run your own scenarios, switching swing states back and forth to see the result. You can also compare results from previous elections, all the way back to 1968.

real-clear-politics-map

But geographic projections don’t tell the whole story –  Political Irony has a great map demonstrating exactly why the Electoral College is a terribly undemocratic way to choose a president – voters in some states have effectively four times the influence of voters in others:

I’m not the first person to notice this of course, so there have been many efforts to show cartograms based on electoral pull.  There’s one at the Dispassionate Liberal and one at American Street, both using data from Pollster.com.

I like the analysis at FiveThirtyEight.com a little better, so I’ll show the latest cartogram from Frontloading HQ:

This map tries to keep the states in the right shapes, if they’re a bit disconnected.  Taking a cue from Michael Gastner, Cosma Shalizi, and Mark Newman at the University of Michigan, here’s a cartogram using the current data from FiveThirtyEight:

fivethrityeight election polling cartogram

A couple of notes – Blue is safe for Obama, Red is safe for McCain.  I compressed “leans” and “likely” categories into one color because it’s late and my eyes are tired.  Also, I’m missing Alaska and Hawaii, I’ll try to find a base map that has them and update.

By the way, here’s another page with interesting maps of 2004 election results analyzed in a number of interesting ways.

I’m still on the lookout for the best map to watch election results as they come in on Tuesday – any suggestions?