We’ve got well over 10,000 votes, we know that the vote totals are significantly different from random, so do we have enough information to pick a name yet?
There’s another stats exercise I want to go through before we narrow down the list. We want to pick a name that people have voted for, but we’d also like to choose a name that’s not too popular. This is just a personal preference that Ann and I have, we think it’s a little more fun to have a more unique name.
Also, it would be pretty boring if the vote gives us the exact same information as a list of most popular baby names. So, how to do we choose a name that’s popular with friends and family (and in our case, random internet strangers), that’s still reasonably unique?
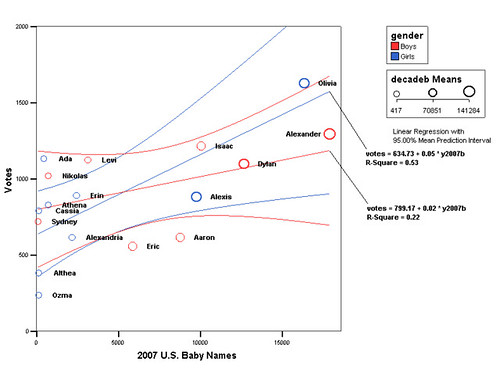
Based on the chart below, names that fit our criteria include Ada, Cassia, Athena, Erin, or Olivia for a girl and Nikolas, Levi, Isaac, Dylan or Alexander for a boy. Follow along and I’ll explain where I got the data and how it helps me pick names.
Link to the full-sized graph at Flickr.
The graph you see above is a scatterplot of the names, showing the vote total versus the number of babies given that name in the U.S. in 2007. For example, Isaac has 1220 votes as of this writing and 10,066 babies were named Isaac in 2007.
To get this chart we need data for baby name popularity, and the Social Security Administration has plenty. We can take the most recent data available (2007), or try names for the current decade. If I wanted to get really fancy I might do some sort of rolling average, or try to catch rising and falling trends, but I’m already doing way too much math for a Sunday afternoon as it is.
So the first question to ask is do the votes and name counts correlate at all? Do names with more votes tend to be more popular? The chart below shows a Pearson Correlation from SPSS, and you can see that the number of votes is correlated significantly with both names for 2007 and names for the decade:
This brings us to the chart above – we know that the number of votes and the name popularity have a positive, linear relationship – so if we graph the linear relationship, we can see which names have more votes than expected and which have less. That’s the linear regression you see in the chart.
Note that really there’s two totally separate lines to consider – the red line for boys and the blue line for girls. Names that fall above their respective lines, like Ada and Levi, have more votes than we would expect just based on popularity.
Above and below the means you see lines for the 95% confidence interval – which is actually pretty wide. Basically we can be confident that if we had 20 babies this year (icosatuplets?), and did an internet vote for each one, the regression line would fall inside those boundaries 19 times. Having one baby has been enough work, though, so I don’t think I’ll ask Ann to test that one. Names that are above the confidence interval will be above the line 95% or the time so we can be very confident that they are favored by our voters more than they are popular in the U.S. In our study, only one name does – Ada.
Another interesting statistic is the R-Square value – for boys, the value of 0.22 means that 22% of the variability of the baby name votes can be explained by popularity in the U.S. in 2007. For girls it’s much higher – 53%. This isn’t exactly the same thing as saying our voters are 53% influenced by popular names when they picked a girls name, but it gives you a good idea how strong the correlation is.
*Here’s another question – what do we do with the names that got votes but didn’t show up in the top 1000? We have no way to know the number of babies with those names. There’s a couple of options – one is to exclude them from study, which isn’t very fun. Another is to just set the name count to zero, since that’s guaranteed to be less than any others in the top 1000 and we don’t have any data on how they compare with each other. For this analysis I’m going to assume the these names were used for some babies, and just split the different between the count for the last name for boys (last year: 191votes, decade: 834) and girls (last year: 262, decade: 1125). This isn’t a particularly good way to do things – I could fit a curve to the distribution of votes and then take the midpoint or something instead, but either way we’re making up numbers, we don’t really know where along the tail end of the curve the names would appear.
they should put “Jason” in the 2008 list, all baby boys around me always have “Jason” as part of their name
What about Linear? It is very unique, but pretty. That is a unique name. ^_^