Tag Archives: SPSS

baby names Chi-Square confidence interval Cramer's V crosstabs CSV Excel Google how-to linear regression plugins poll popularity R-Square statistical analysis statistical significance survey SurveyMonkey WordPress

Choosing a Unique Baby Name with Statistics

We’ve got well over 10,000 votes, we know that the vote totals are significantly different from random, so do we have enough information to pick a name yet?

There’s another stats exercise I want to go through before we narrow down the list.  We want to pick a name that people have voted for, but we’d also like to choose a name that’s not too popular.  This is just a personal preference that Ann and I have, we think it’s a little more fun to have a more unique name.

Also, it would be pretty boring if the vote gives us the exact same information as a list of most popular baby names.  So, how to do we choose a name that’s popular with friends and family (and in our case, random internet strangers), that’s still reasonably unique?

Based on the chart below, names that fit our criteria include Ada, Cassia, Athena, Erin, or Olivia for a girl and Nikolas, Levi, Isaac, Dylan or Alexander for a boy.  Follow along and I’ll explain where I got the data and how it helps me pick names.

Scatterplot of baby name votes versus baby name popularity

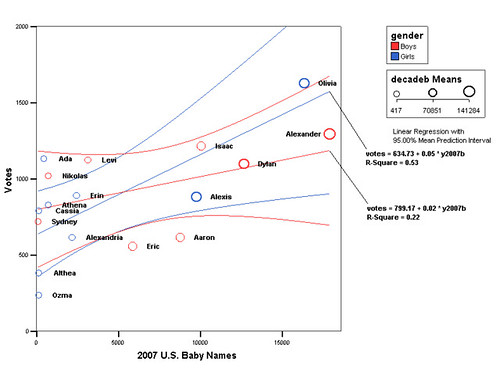
Link to the full-sized graph at Flickr.

The graph you see above is a scatterplot of the names, showing the vote total versus the number of babies given that name in the U.S. in 2007.  For example, Isaac has 1220 votes as of this writing and 10,066 babies were named Isaac in 2007.

Continue reading

Baby Name Significance (and other gratuitous statistics puns)

Twisted tree branches

Now that we have more than 10,000 votes in our baby name poll I can start doing some basic statistical analysis.  One of the things I’d like to do is figure out which names are popular in our poll, but still relatively unique compared to all those other babies being named out there.

Before I get to that, though, I want to make sure that our vote totals are significantly different from random.

Heads up:  What follows is a basic intro to some concepts in statistics that I’m writing mainly to keep myself sharp.  I haven’t done much research recently and I don’t want to get rusty.  Feel free to read along, at the end I’ll show you how to detect the influence of Australians.

Since the data for names included in the poll is completely different from the write-in votes, we’ll concentrate on the pre-selected names for now.

Continue reading

Create a survey or poll for your blog with Google Docs and Spreadsheets

You may have noticed the snazzy poll I posted on my blog the other day.  There’s a number of different survey and poll plugins for WordPress but all the ones I’ve looked at have caveats and limitations.  You can also use a service like SurveyMonkey but it has some data limitations for free accounts.  Instead, I used Google Docs and Spreadsheets to create a survey quickly and easily.  Here’s how to do it.

1. Getting to Google Docs and starting your form

We’re going to assume you have a Gmail account or have signed up for some other Google service already.  Go to http://docs.google.com.  Click on New -> Form

2.  Creating your form

This is actually pretty easy, and the online help does a pretty good job explaining what to do.  You have a number of options when creating a question – you can make it multiple choice, full text, or even a numerical scale, and you can mark some questions as required.  If you’re looking for the “Add question” button, it’s up at the top of the page rather than below the last question.

3.  Publishing the survey on your site

After you’ve created your form, use the More Actions button to find the Embed option.  Just copy this iframe into your blog post – it’s that simple. You’ll get code that looks something like this:

<iframe src=”http://spreadsheets.google.com/embeddedform?key=ppevxmL24UqnRb77Xy3AOWg” width=”310″ height=”1044″ frameborder=”0″ marginheight=”0″ marginwidth=”0″>Loading…</iframe>

You can change the height and weight to better fit your blog template.  Keep in mind that some blogging software will not let you post HTML code and others, like WordPress, require you to use the HTML view.

If you can edit your template or sidebar you can even include the poll on every page, instead of just putting it in a post.

4.  Getting data

Here’s where it gets really cool – the data is automatically collected into a spreadsheet that you can share, edit online, or export to Microsoft Excel.  It’s pretty easy to export CSV for a statistical package like SPSS too.

There’s an optional fifth step, creating a chart or graph to let your users see the results, that I’ll cover later.  If you can’t wait just jump back to my post about urban usability and read about how I created the time-series chart there.