If you’ve ever moved to a new city and looked for a house or apartment you know how difficult it can be. What neighborhood, which side of town? Can we live close to my wife’s workplace and not to far from mine?
I thought I would share the method I used to find our last house, using Photoshop to build a heat map of the city. Note that this is NOT the method I used to find our current apartment – watch this space for more news on that coming up.
Step 1 – Build a map
In order to build our heat map you’ll need a base map to place everything on. Back in 2004 when I did this project Mapquest was still the best thing going, so that’s what I used. If I were doing it now, I would go with Google Maps.
This is the most tedious step, since you’ll need to center your map, take a screenshot, then cut the map portion of the screenshot and paste it into your working image. If you have a scanner and a nice print map you’d like to use instead, feel free to go that route.
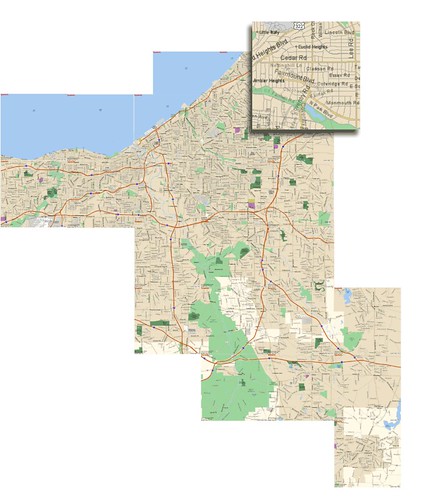
You can see my example, a map for the Greater Cleveland area, below. Click to see a larger version. The inset shows you the level of street detail I found best – zoomed in close enough to see all the streets, but not so close as to make your map unusably large.
Step 2 – Place your main locations
What are the three most important factors in real estate? Location, location, location. In our case we want to live close to the locations we need to go to on a regular basis. For us that was two workplaces and two universities.
Heat maps are a great way to visualize information. They are a perfectly appropriate choice for map location and distance information. So create a new layer in Photoshop. Choose the gradient tool and make sure you’re using a Radial Gradient. The gradient should go from a solid color (I chose blue) to transparent. Using the map, create a radial gradient about as wide as you would like to drive.
These smooth gradients can make it hard to make distinctions when you are zoomed in and, on a large map, will take up a lot of disk space. So an alternative method would be to create a series of coencentric circles, each smaller than the last. That’s the method I used in the example below.
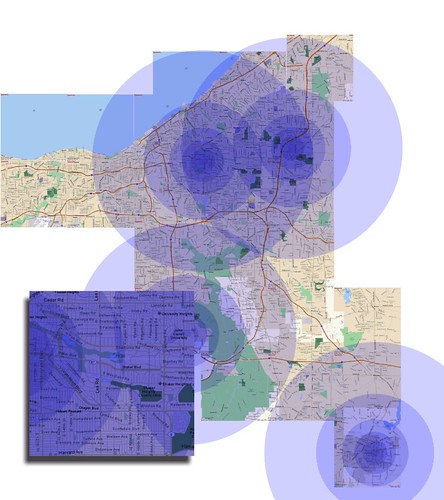
Once you have one good circle layer, copy it for each of the locations you want on your map and drag them in to place. You’re probably going to want to change the blending mode for the layers so that you can still see map details – I recommend using Multiply and lowering the opacity just a bit.
In my example map, you can already see how this could help narrow down which neighborhoods to look in. It also shows quite visually that there’s no point in trying to live closer to Kent – it doesn’t intersect with any of the other hot spots.
In part 2, we’ll take a look at pulling in data maps for things like crime statistics , highlighting other map features, and pulling it all together. Also, I’ll have an exciting announcement about another project I’ve been working on soon as well. Stay tuned.
This is actually really interesting. I’ll hold off on a more thorough comment until your next post…looking forward to it!