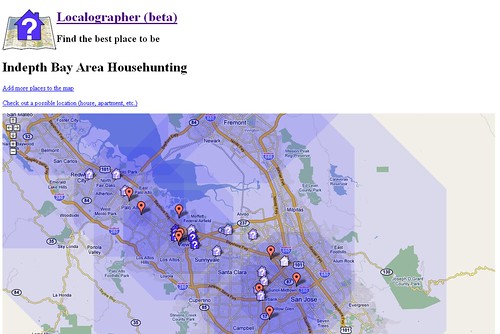
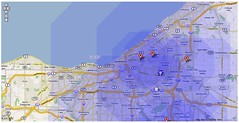
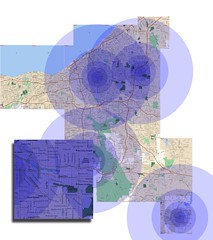
I have a little project called Localographer, which you can use to create heat maps and find a house or apartment near your workplace, friends and relatives, or other place you’d like to be. When I showed it to my brother he tried mapping out places in Boston and ran into a limitation – the interface doesn’t show you various transit options and it doesn’t make it easy to figure out the real cost and benefits of living in different places.
If you move to the suburbs, you might be able to commute by car but living by a train stop can be cheaper and easier. In some neighborhoods you can get 10 different kinds of food in a 10 minute walk, in others you need to get in your car and drive a quarter mile to get anything to eat at all.
Adding features like this to Localographer means solving two problems – data and user interface. I don’t have access to restaurant locations, transit stops, etc. and that sort of data can be expensive to get from commercial sources. I could go the wiki route but that would require building an interface for users to contribute data and finding ways to make the data more reliable.
So in the mean time, if you want to get an idea of how walkable a potential neighborhood might be, take a look at Walk Score. It’s a very cool site which has some of the features I’ve been meaning to add to Localographer – you can get a score for how livable the area around any address might be.
For example, my current neighborhood in California has a score of 74 out of 100. Our house in Shaker Heights scores 62 out of 100. Because any excuse is a good excuse to use a spreadsheet and a graph, I’ve plotted out the walkability of all the places I’ve lived using a Google Docs spreadsheet and the Interactive Time Series Gadget. I wrote earlier about how you can embed any Google Doc or Spreadsheet into a blog post but Gadgets are even easier – just click the “Publish” button on the gadget and paste the Javascript code in the raw HTML view of your blogging software.
There are some issues with Walk Score, of course – for example Naples, Florida scores very high, but when I lived there I really missed having access to a car. Most of the restaurants and shops along 5th Street and Tamiami Trail were out of my internship-funded price range. I used to bike some distance to get to The Clock, a cheap diner.
All of this discussion is pointing toward a much larger question that I have been thinking about for a long time – I know how to study the usability of web sites and other software, but I wonder if anyone does usability studies of urban planning? I’ve seen traffic flow studies and I know building codes have some basis in ergonomics and accessibility, but does anyone do observational studies of how people interact with different urban environments to figure out what works and what doesn’t? Is there a Fitt’s Law of where to locate grocery stores compared to condos?