Visualizing the web
Although web technologies are constantly changing, most users still browse the web the same way they did back in 1995–typing keywords into search boxes, clicking from home page, to section, to subsection on a navigation bar, or following link, to link, to link. The fact that it is called a “web” suggests that there should be other ways of navigating websites, and there are a number of projects attempting to employ information visualizations and spatial maps to do so.
All web pages organize information visually, but “information visualization centers around helping people explore or explain data that is not inherently spatial, such as that from the domains of bioinformatics, data mining and databases, finance and commerce, telecommunications and networking, information retrieval from large text corpora, software, and computer-supported cooperative work.” (“InfoVis 2003 Symposium”) Spatial metaphors are used to communicate different levels of information. A simple, static example would be a personal homepage built to look like the designers home, with links to favorite movies in the living room and recipes in the kitchen. A more advanced example would be a customer relationship management system for a large company which instead of presenting a list of technical support problems and solutions, displays an interactive map of problems, with more common problems in a larger font size, and recent problems in red. In both cases, users get an immediate grasp of complex information.
Such visualizations are intended to help solve two current web usability problems: the lack of a wide view to web structure, and the lack of query refinement based on relationships of retrieved pages (Ohwada 548). But they must do so without creating additional usability barriers. This paper will describe three current information visualization projects and describe some of the usability issues these sorts of projects face.
Many visualizations, including the three below, are not designed for specialists but instead are “targeted toward guiding the public through newly accessible oceans of on-line information.” (Morse 637) This means that many of their target users will be unfamiliar with both the interface and the particular information they are looking for.
Current Projects
Gnovies
Gnovies (Gibney) is an online movie recommendation engine. Users are asked to provide movies that they like, and then are presented with movies they might also like–the recommendation algorithm is based on previous users’ responses. More importantly for this discussion, Gnovies includes a “Movie Map” function, which allows users to type in a movie title to see a map of movies that are related based on previous users’ responses. The related movies drift around the page, clustering into groups of films that are similar according to the algorithm. Any movie can be clicked on to bring it, and it’s related films, up. Relationships are delineated solely by proximity, and little else is presented–each movie also brings up a link to Amazon.com in the lower left hand corner. Similar projects for music, authors and web sites can also be found.
Gnovies uses two technologies to achieve this effect: server-side functions (accepting user input, storing and retrieving information, and the recommendation engine) are scripted in PHP; the PHP scripts output HTML and Javascript, which displays the text and arranges the visualization. All major graphical browsers support Javascript to some extent, and the site works in recent version of Netscape and Internet Explorer on PC, but there are notorious incompatibilities between different browsers and different versions of the same browser. The Gnovies script tries to take this into account by detecting the browser and sending appropriate code accordingly. Unfortunately, the page fails to display correctly on text-only browsers. Use of the visualization is fairly straightforward, but there are some immediate usability concerns–movie titles often float over each other, making it difficult for users to click on the one they want.
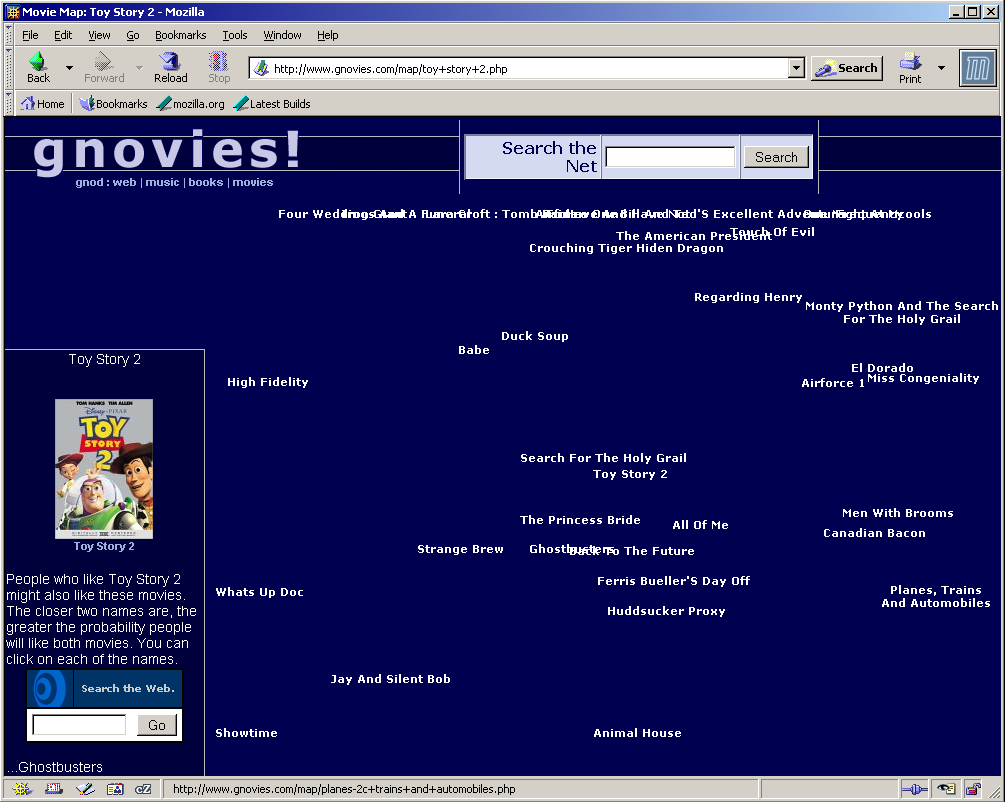
Figure 1, Gnovies spatial map of ‘Toy Story 2’
TouchGraph
TouchGraph is a larger project that has been applied by different developers to allow users to surf a number of sites visually. Three are of particular interest: GoogleBrowser (Shapiro), which makes use of Google’s “related:” search operator (“Advanced Google Search Operators”) to create a map of relationships between web sites, PubMed Browser (Eaton), which allows users to search Medline’s medical journal database visually, and AmazonBrowser (Shapiro), which allows users to navigate Amazon.com’s suggestions visually. All three work similarly: users start at a regular HTML page and are able to type in a URL or search phrase. GoogleBrowser uses a PHP/NuSOAP script to access Google’s web services, AmazonBrowser uses Perl script, and PubMed uses PHP. All three submit results to the TouchGraph Java application, which displays search item in the center with results arrayed around with visual rays drawn out to each. Each item displays all or part of the title and lights up, displaying the whole title and an info tab, when moused over. Double clicking on the info tab brings up a new window with the abstract in PubMed or the actual site in GoogleBrowser and AmazonBrowser. Double clicking on the title expands that node, showing its related documents. Several nodes can be expanded at once, showing more complex relationships, and there are additional settings to control the number of results displayed and how they are displayed. There is also a back button which takes users back to the last node they had opened.
TouchGraph is a Java application and requires Java 1.3 or higher installed on the user’s system. Although Java is available for most operating systems, it is not installed by default on most systems. Use of Java also means increased download time and complete inaccessibility to text browsers.
 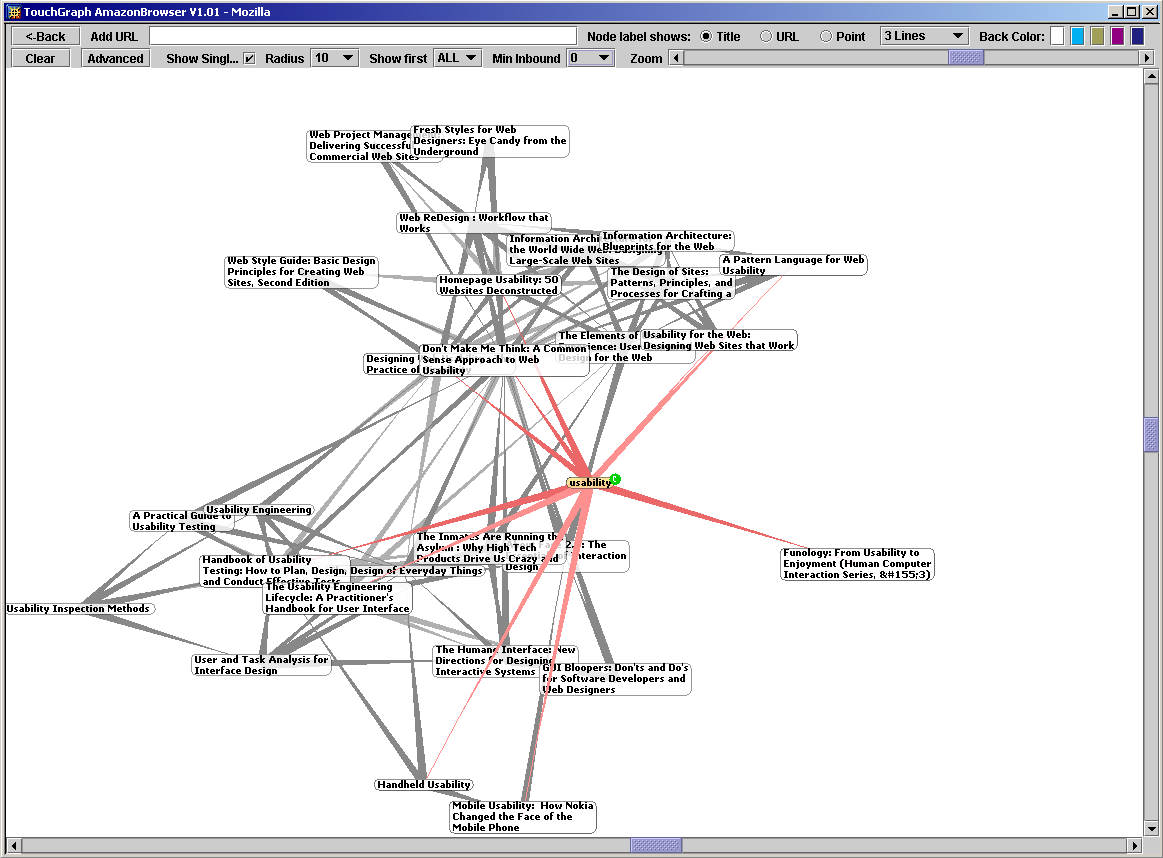
Figure 2, AmazonBrowser (TouchGraph) search for ‘usability’
Hogdex
Hogdex (McKeller) is a Toronto, Canada news index site. The site employs a crawler to index local news websites and then organizes the top 100 words in headlines today with a visual “splatter.” Words that occur more frequently appear larger, and words that are closer together are more likely to appear together in a headline. Each word is a link to a search results page, showing users a more conventional list of sites with description text and links.
Hogdex is unique in that it employs CSS to generate its spatial map. Most browsers have CSS support to some degree, and almost all would support the code here. Also, because of the nature of CSS, text browsers should have not problem rendering the text and the links as a list. Although formatting will be lost, the site is not completely broken. Unlike the other two projects reviewed, Hogdex is not completely interactive–the splatter changes each day based on crawler results, not user input.
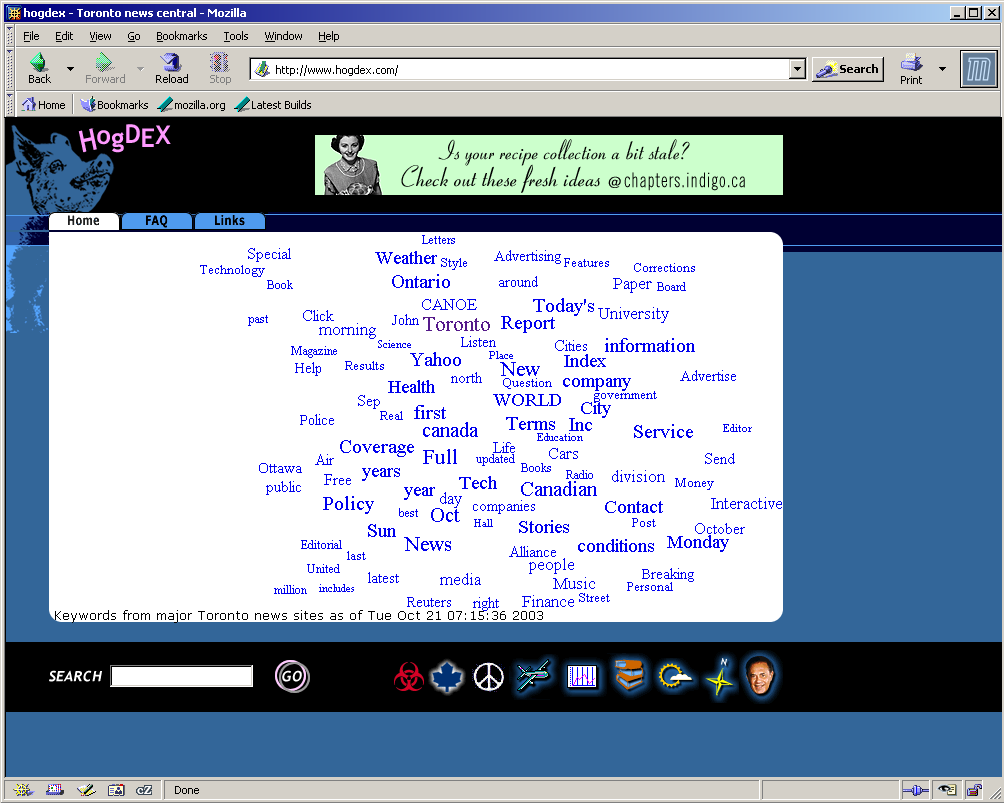
Figure 3, Hogdex home page, 21 October 2003
Evaluating visualizations
Any number of usability guidelines can be found. A quick run through of four guidelines from a usability textbook (Dumas 56) and five from a popular usability site (Nielsen 2003) in regards to these projects will provide a good overview.
User control
None of these projects give the user much more control than they might already have through a standard navigation system or search engine. TouchGraph gives users some additional controls for how many nodes are shown, zooming, etc., but PubMed for example is a single, unqualified search of a very large and complex database. Users may want to be able to search specific fields, etc.
Consistency
All three are consistent within their own system, but in Hogdex and TouchGraph once a users find an item they are taken to standard web pages, which work differently. Part of the point of these projects is to avoid the standard web page look and feel, so it is hard to see how this level of inconsistency is avoidable.
Feedback
The TouchGraph projects are particularly good in this regard, highlighting nodes and rays under the mouse pointer, allowing users to move nodes around, and displaying small “loading” messages while downloading.
Supporting limited memory
TouchGraph is the only project that addresses this, with its back button. This is not as useful as a history list, however. Hogdex’s spatial map is only used on the homepage, so this functionality is not as necessary.
Learnability
This is hard to judge without proper testing. Hogdex is the most similar to most web navigation systems, followed by Gnovies then TouchGraph. Assuming familiarity leads to learnability, Hogdex would be the most learnable.
Efficiency
This is almost impossible to determine without proper usability testing. In terms of load times, Hogdex’s CSS/HTML starts faster than Gnovies’ HTML/Javascript and TouchGraph’s Java. Java applications can be particularly tedious to download, especially the first time a user visits the site.
Memorability
Again, this is difficult to judge. If novelty is related to memorability, than this factor would rank opposite of learnability. TouchGraph is the most unusual of the three, and assuming users learn it, it is possible it would be the most memorable.
Errors
Most errors in these systems would simply result in retrieval of poor search results. TouchGraph, which allows multiple nodes open at the same time, better allows users to return to relevant results.
Satisfaction
This is a subjective measure, best rated by preference questionnaires after a usability test.
There is some evidence that user satisfaction is not directly related to user success (see the discussion of past usability testing results below).
Usability Testing
It is beyond the scope of this paper to describe in detail the planning and execution of a usability test. Despite differences with more prevalent navigation systems, all of these projects are web interfaces intended to allow users to interact with information in some way. Therefore, the general principles of usability testing apply, and articles can be found describing heuristic evaluations, usability tests, cognitive walkthroughs, and prototyping of similar systems. It is valuable, however, to look at usability issues specific to visualizations.
How do we gauge the usability of navigation systems that are relatively new and uncommon? There is comparatively little literature and empirical studies can be hard to find. Part of this difficulty is due to the lack of agreement over the terms themselves. In this paper the terms “spatial map,” “information map,” “visualization,” and “information visualization” are used interchangeably, but elsewhere similar projects fall under categories like “information retrieval” (Morse 637), “artificial intelligence” (Gibney), “browsers” (Eaton), etc. One such study (Heo 666) summed up the state of affairs well:
“There have been many efforts to create visualization tools that reduce the problems related to hypertext document spaces, particularly Web space. However, most of these tools were engineered without theoretical or experimental bases. They use information representation techniques that seem to be arbitrarily chosen. This approach is not optimal because many techniques may have counterintuitive or unintended consequences.”
Judging Usability Problems
Just as any complex program is bound to have bugs, any complex system is bound to have usability problems (Dumas 160). But those problems do vary in severity; problems can be thought of as falling under three categories:
-
Severe–prevents the user from completing a task or results in catastrophic loss of data or time.
-
Moderate—significantly hinders task completion but users can find a work-around.
-
Minor—irritating to the user but does not significantly hinder task completion. (Artim, 1).
Because most visualizations and spatial maps are intended to organize information or assist the user in finding relationships between objects, severe usability problems seem unlikely. Although users may fail to complete their tasks, most of these systems have no functionality that could lead to “catastrophic” losses. Moderate and minor problems seem much more likely–if users do not figure out how to find what they are looking for, they are likely to become irritated, and if the problem persists they will likely find ways around using the system as it is intended–bookmarking specific pages, so they can go to them and skip the navigation system, for example.
Does this mean that usability is not a critical issue for these systems? Obviously not–the only way a user is going to navigate one site differently than they navigate most of the rest of the web is if the new system is more usable than the standard. Problem severity can be rated based on three factors (Nielsen 1995):
- Frequency–is the problem common or rare?
- Impact–will the problem be easy or difficult for the users to overcome if it occurs?
- Persistence–is it a one-time problem that users can overcome once they know about it or will users repeatedly be bothered by the problem?
Approaches
In addition, visualization usability can be broken down into two stages (Morse 639):
-
-
-
Can the user perform the visual tasks the features require (such as identifying groups and clusters)?
-
Can the user use these features on the task at hand.
-
-
In order to more exactly identify these problems, visualizations can be “defeatured” in order to determine if the visualization itself is contributing to usability rather than any other associated features (search boxes, other forms of navigation included, etc.) (Morse 639). If usability testing is included as part of the product development process, defeaturing at the end may be unnecessary–individual features can be tested as they are available, and corrections made before the final product is produced.
Also, usability tests must be careful to separate errors that arise from the interface and those that do not. For example, do errors (or time per task, or other measures) decrease quickly over time, meaning that once users gain familiarity with a new systems problems evaporate? Or do measures stay stable, or not decrease quickly when compared to similar tasks with familiar interfaces, meaning there are persistent issues? It is also important to identify the nature of errors. If a user is asked to search for musicians similar to David Bowie, a spatial map is unlikely to help or hinder results when the user types in “David Bowy.” Do these problems:
- Disappear quickly with familiarity?
- Arise from simple mistakes, such as typing errors, etc.?
- Seem particular to a certain group of user?
- Have no relationship to the particular interface, or still occur in familiar interfaces?
Common pitfalls
Explorations of the three projects above and a review of the literature suggest there are a number of problems many visualizations have in common:
Lack of history
One problem that the Java and Javascript projects have in common is a reliance on user memory. As users click form one node to the next along the web display, they have no way of knowing how they have arrived at a specific location past what they can remember. TouchGraph has a back button, but it does not show a history or automatically collapse nodes. Some other visualization projects have included a history feature, where a list of visited nodes is kept allowing the user to go back to any point along the path that has brought them to their current node (Risden 700). Another study specifically mentioned the lack of a history feature as a usability problem (Sutcliffe 750).
Unclear metaphors
All of these systems rely on visual metaphors to communicate meaning. Many of them seem obvious–larger objects are more important, closer objects are more related–but others may seem obvious to some users and not others. If using color codes, for example, the use of red, yellow and green might naturally seem to mean “stop,” “slow,” and “go” respectively. But if documents returned from a query are colored on a scale from red to yellow to green, should users assume that red means “stop, this is a bad result” or “pay attention, this is the best result” as on a radar map of a thunderstorm? At least one study found that users had serious misunderstandings of some of the system metaphors (Sutcliffe 752).
Hiding important details
In the same study, users were found to have misconceptions of how their queries were being carried out and how the system got the results it displayed in its visualizations. Some users expected to be able to use Boolean operators in the search box, but the system did not support them. Users were also unsure about filters and “find similar to this article” functionality. In an informal test, a graduate nursing student was surprised by the results of a PubMed Browser search for “diabetes mellitus.” She assumed that since the interface was a small, simple search box, the system would be using Medline’s medical dictionary or something similar. The resulting map was understood by the user but not very useful, since it displayed the first ten articles with “diabetes mellitus” as the subject with no apparent relevancy ranking. She concluded that it probably wouldn’t be very useful for searching technical journal articles.
Since many of these systems are intended to make browsing interrelated information easier, it’s not surprising they might wish to conceal complicated or technical details. Concealing details that users might find useful, or not notifying them when functionality is different from what they might expect, however, is counterproductive.
Not anticipating user expectations
Although Hogdex has not undergone any usability studies, it’s creator was able to detect some problems he had not anticipated. “I noticed people using the site expected it to be about all
aspects of the city. For example they were searching for names of tourist attractions and other things that you would not expect to be in the news. So I figured -what the heck- and expanded
the site to cover that sort of info. The splatter remains only news.” (McKellar). Users also tended to include the word “Toronto” in searches, despite the fact that the site is constrained to Toronto-area resources already. Searches for “Toronto restaurant” might not have retrieved articles about “local restaurant” or “restaurant in the city.” Once user expectations are known, search algorithms, metaphors, and other features can be adjusted to make the site much more usable.
Past usability testing results
Information visualization is a relatively new field and although there are many papers and web sites describing or proposing systems, fewer report the results of actual usability tests. Those that do very widely in their methods and results (Chen 863). Further research is clearly necessary, but there is some suggestion that these sorts of visualizations do helps users in some tasks. A number of tests and relevant results are discussed below.
In one empirical test of a 3D information visualization system named XML3D, users were asked to navigate the Snap.com directory with either XML3D or one of two more standard web interfaces (Risden 700). The study’s participants all had two or more years of programming experience and were asked to complete tasks related to categorizing new web sites into the directory. Users were found to complete three out of four tasks significantly faster with the visualization tool, with no loss in accuracy. Oddly enough, users rated the visualization tool slightly lower than the standard navigation systems, although the difference was not significant.
Another study had users perform two- or three-term boolean searches using several different displays for results (Morse 655). Participants were not experts, but on average used computers daily and had been using computers for over five years. In terms of time to complete, the “spring” display in which results are mapped in relationship to search terms on the corners of the field was significantly better than the more conventional word, icon list, and table displays. The spring display also had results as accurate as the icon list and table displays (all were more accurate than the word displays). In addition, more complex tasks did not have as large of an effect on time results for the spring display. Again, when asked to rate the different displays, the spring display was not users’ favorite.
This theme of users not necessarily liking the tool that proves most effective can also been seen in the converse. In one study of a visualization system that included a search box, visual thesaurus hierarchy, and a spiral map with more relevant documents closer to the center, users rated the system highly despite poor performance (Sutcliffe 749).
Not all studies have found visualizations and spatial maps to be significantly better than other methods. In one study, users were asked questions that required them to find pages within a large (about 600 page) or small (about 50 page) web site (Heo 668). Participants used one of four interfaces: a distortion browser, where more relevant items were larger, a zoom browser, with a spatial map that users could zoom in on specific areas, an expanding outline browser, where items were seen in a hierarchy of folders that could be expanded to reveal contents, and a control group with a simple text box search. Users with the expanding outline browser performed better than the other two visualization groups, but not better than the control group.
Conclusion
It is unclear whether information visualizations and spatial maps inherently enhance the usability of web sites services, but the nature of the web, failings of common navigation systems, and some studies indicate that they may have a positive effect in some situations. The question is far from answered, though; not enough studies have been done, those that have been published often test vastly different systems, populations, and variables, and there is disagreement over whether visualizations have a positive or negative impact. It is clear that any visualization should be tested for usability problems, preferably with actual users. When evaluating visualizations, there are a number of factors specific to these systems that should be kept in mind. Problems may occur when users are either unable to use or understand the visual features of the system, or when they are unable to then apply that use to the task at hand. When problems are found, they must be analyzed to see if they disappear quickly with familiarity, arise from simple mistakes, seem particular to a certain groups of user, or have no relationship to the particular interface and still occur in familiar interfaces. Common pitfalls include not supporting user memory with a history feature, unclear metaphors, hiding important details that users should have access to, and not anticipating user expectations.
Works Cited
Artim, John M. “Definition: Usability Problem Severity Ratings.” Primaryview. Jan 2003. <http://www.primaryview.org/CommonDefinitions/Severity.html> (19 Oct 2003).
Chen, Chaomei and Yue Yu. “Empirical studies of information visualization: a meta-analysis.” International Journal of Human-Computer Studies. Volume: 53, Issue: 5, November, 2000. pp. 851-866.
Dumas, Joseph S., and Janice C. Redish. A Practical Guide to Usability Testing. Portland, OR: Intellect Books, 1999.
Eaton, Alf. Pubmed Browser. 28 Jan 2003. <http://www.pmbrowser.info/pubmed.htm> (21 Oct 2003).
Gibney, Marek. Gnovies! Discover new movies. <http://www.gnovies.com/> (19 Oct 2003).
“Advanced Google Search Operators.” Google. Google, Inc. 2003. <http://www.google.com/help/operators.html>. (21 Oct 2003).
Heo, Misook and Stephen C. Hirtle. “An empirical comparison of visualization tools to assist information retrieval on the web.” Journal of the American Society for Information Science and Technology Volume: 52, Issue: 8, 2001. pp. 666 – 675.
“InfoVis 2003 Symposium.” infovis.org. IEEE. 30 September 2003. <http://infovis.org/infovis2003/> (21 Oct 2003).
McKellar, David. Hogdex. 19 Oct 2003. <http://www.hogdex.com/>. (19 Oct 2003).
McKellar, David. “Re: Hogdex–details on splatter” djm@hogdex.com (20 Oct. 2003).
Morse, E. and M. Lewis. “Evaluating visualizations: using a taxonomic guide.” International Journal of Human-Computer Studies. Volume: 53, Issue: 5, November, 2000. pp. 637-662.
Nielsen, Jakob. “Severity Ratings for Usability Problems.” Useit.com. 1995. <http://www.useit.com/papers/heuristic/severityrating.html> (19 Oct 2003).
Nielsen, Jakob. “Usability 101: Fundamentals and Definition – What, Why, How.” Jakob Nielsen’s Alertbox. 25 Aug. 2003. <http://www.useit.com/alertbox/20030825.html> (5 Oct. 2003).
Ohwada, Hayato and Fumio Mizoguchi. “Integrating information visualization and retrieval for WWW information discovery.” Theoretical Computer Science. Volume: 292, Issue: 2, January 27, 2003. pp. 547-571.
Risden, Kirsten and Mary P. Czerwinski. “An initial examination of ease of use for 2D and 3d information visualizations of web content.” International Journal of Human-Computer Studies. Volume: 53, Issue: 5, November, 2000. pp. 695-714.
Shapiro, Alex. “TouchGraph GoogleBrowser V1.01.” TouchGraph. 2003. <http://www.touchgraph.com/TGGoogleBrowser.html> (21 Oct 2003).
Shapiro, Alex. “TouchGraph AmazonBrowser V1.01.” TouchGraph. 2003. <http://www.touchgraph.com/TGAmazonBrowser.html> (21 Oct 2003).
Sutcliffe, A. G., M. Ennis and J. Hu. “Evaluating the effectiveness of visual user interfaces for information retrieval.” International Journal of Human-Computer Studies. Volume: 53, Issue: 5, November, 2000. pp. 741-763.
One thought on “Information visualizations and spatial maps on the web – Usability concerns”
Comments are closed.